Tracking Zone Entries: Why the Blackhawks Controlled Possession But Lost 4-1
Chicago controlled possession against the Islanders, but micro-stats tell a different story.

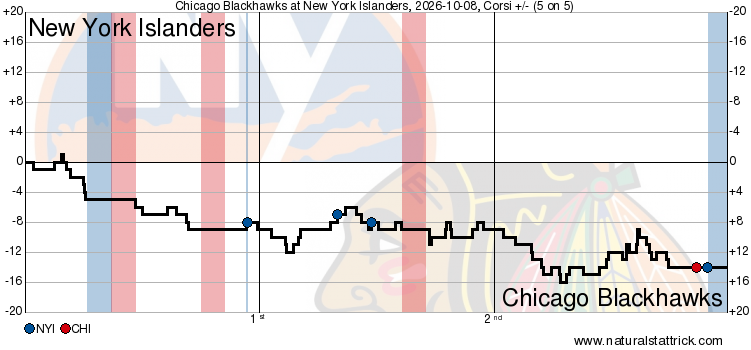
We're going to be doing something a little different for today's recap (and probably all recaps from here on out). Because of my work schedule and school just starting up, most games I catch are replays. For this 4-1 loss to the New York Islanders, I tried something new: I tracked all zone entries for the Chicago Blackhawks.
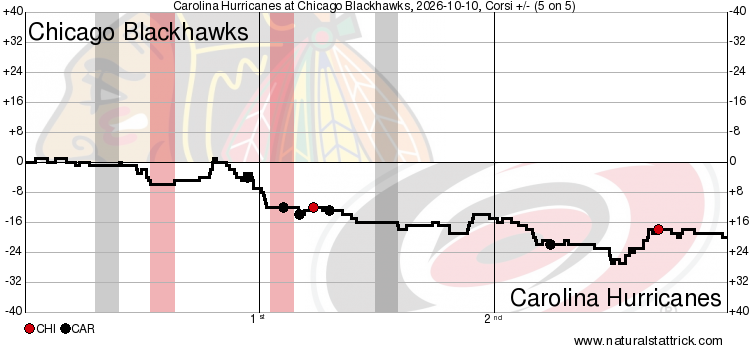
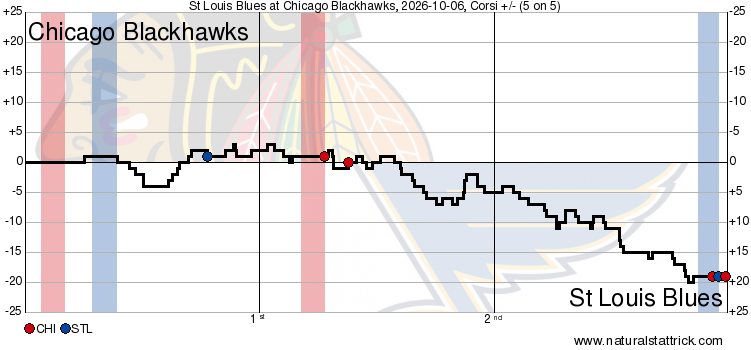
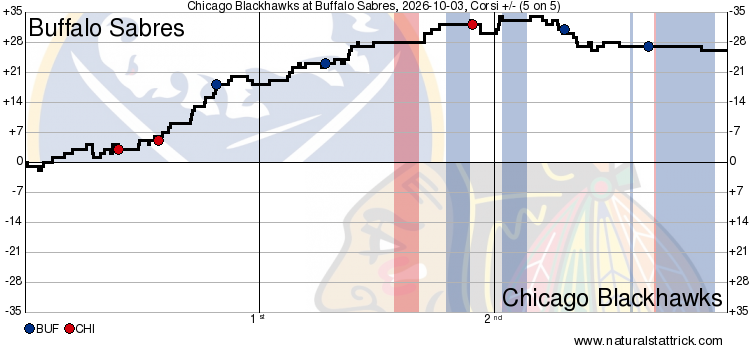
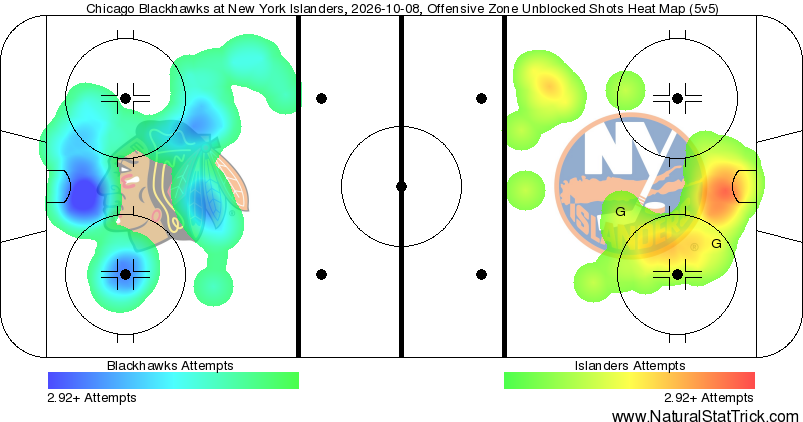
Through 48:15 minutes of 5-on-5, Chicago controlled puck possession with a 59.72 percent Corsi and a 58.7 percent expected goals share. Of the Hawks' 43 shot attempts, only 28 were unblocked. The Islanders had 29 shot attempts, but 20 of them were unblocked. Below is the unblocked shot heat map via naturalstattrick.com.
Tracking the Hawks' zone entries led to some interesting findings. Once I refine my process for stat tracking, I'll do a separate post detailing my method. But for now, I recorded whether an entry was controlled, uncontrolled, or failed. Controlled entries included carries or pass-ins, and uncontrolled entries included dumps and tip-ins (I excluded dump and changes). Failed entries were those where the play was killed shortly after crossing the blue line. I counted 57 offensive zone entries with 43.6 percent that failed and 39 percent that were carries.
The failure rate isn't too surprising. The Islanders played a tight gap and stood up the blue line, which stifled Chicago's offensive zone entries. Players who struggled with entries included Oliver Moore, who had five failed entries with four being successful. Moore also tied for the most 5-on-5 giveaways with two.
Moore started the night on the topline with Patrick Kane and Frank Nazar. The trio played 5:03 together and generated a meager 47.77 expected goals share. The Blackhawks with Moore on the ice generated a 37.45 expected goals share.
I think one of the questions headed into the season was whether or not Moore would be a top-six player or if he would be better suited on the wing versus center. As a winger, Moore is first on the forecheck, but I didn't see many won puck battles. On the wing on the top line, Moore didn't finish on his two scoring chances, and his three shot attempts missed the mark.
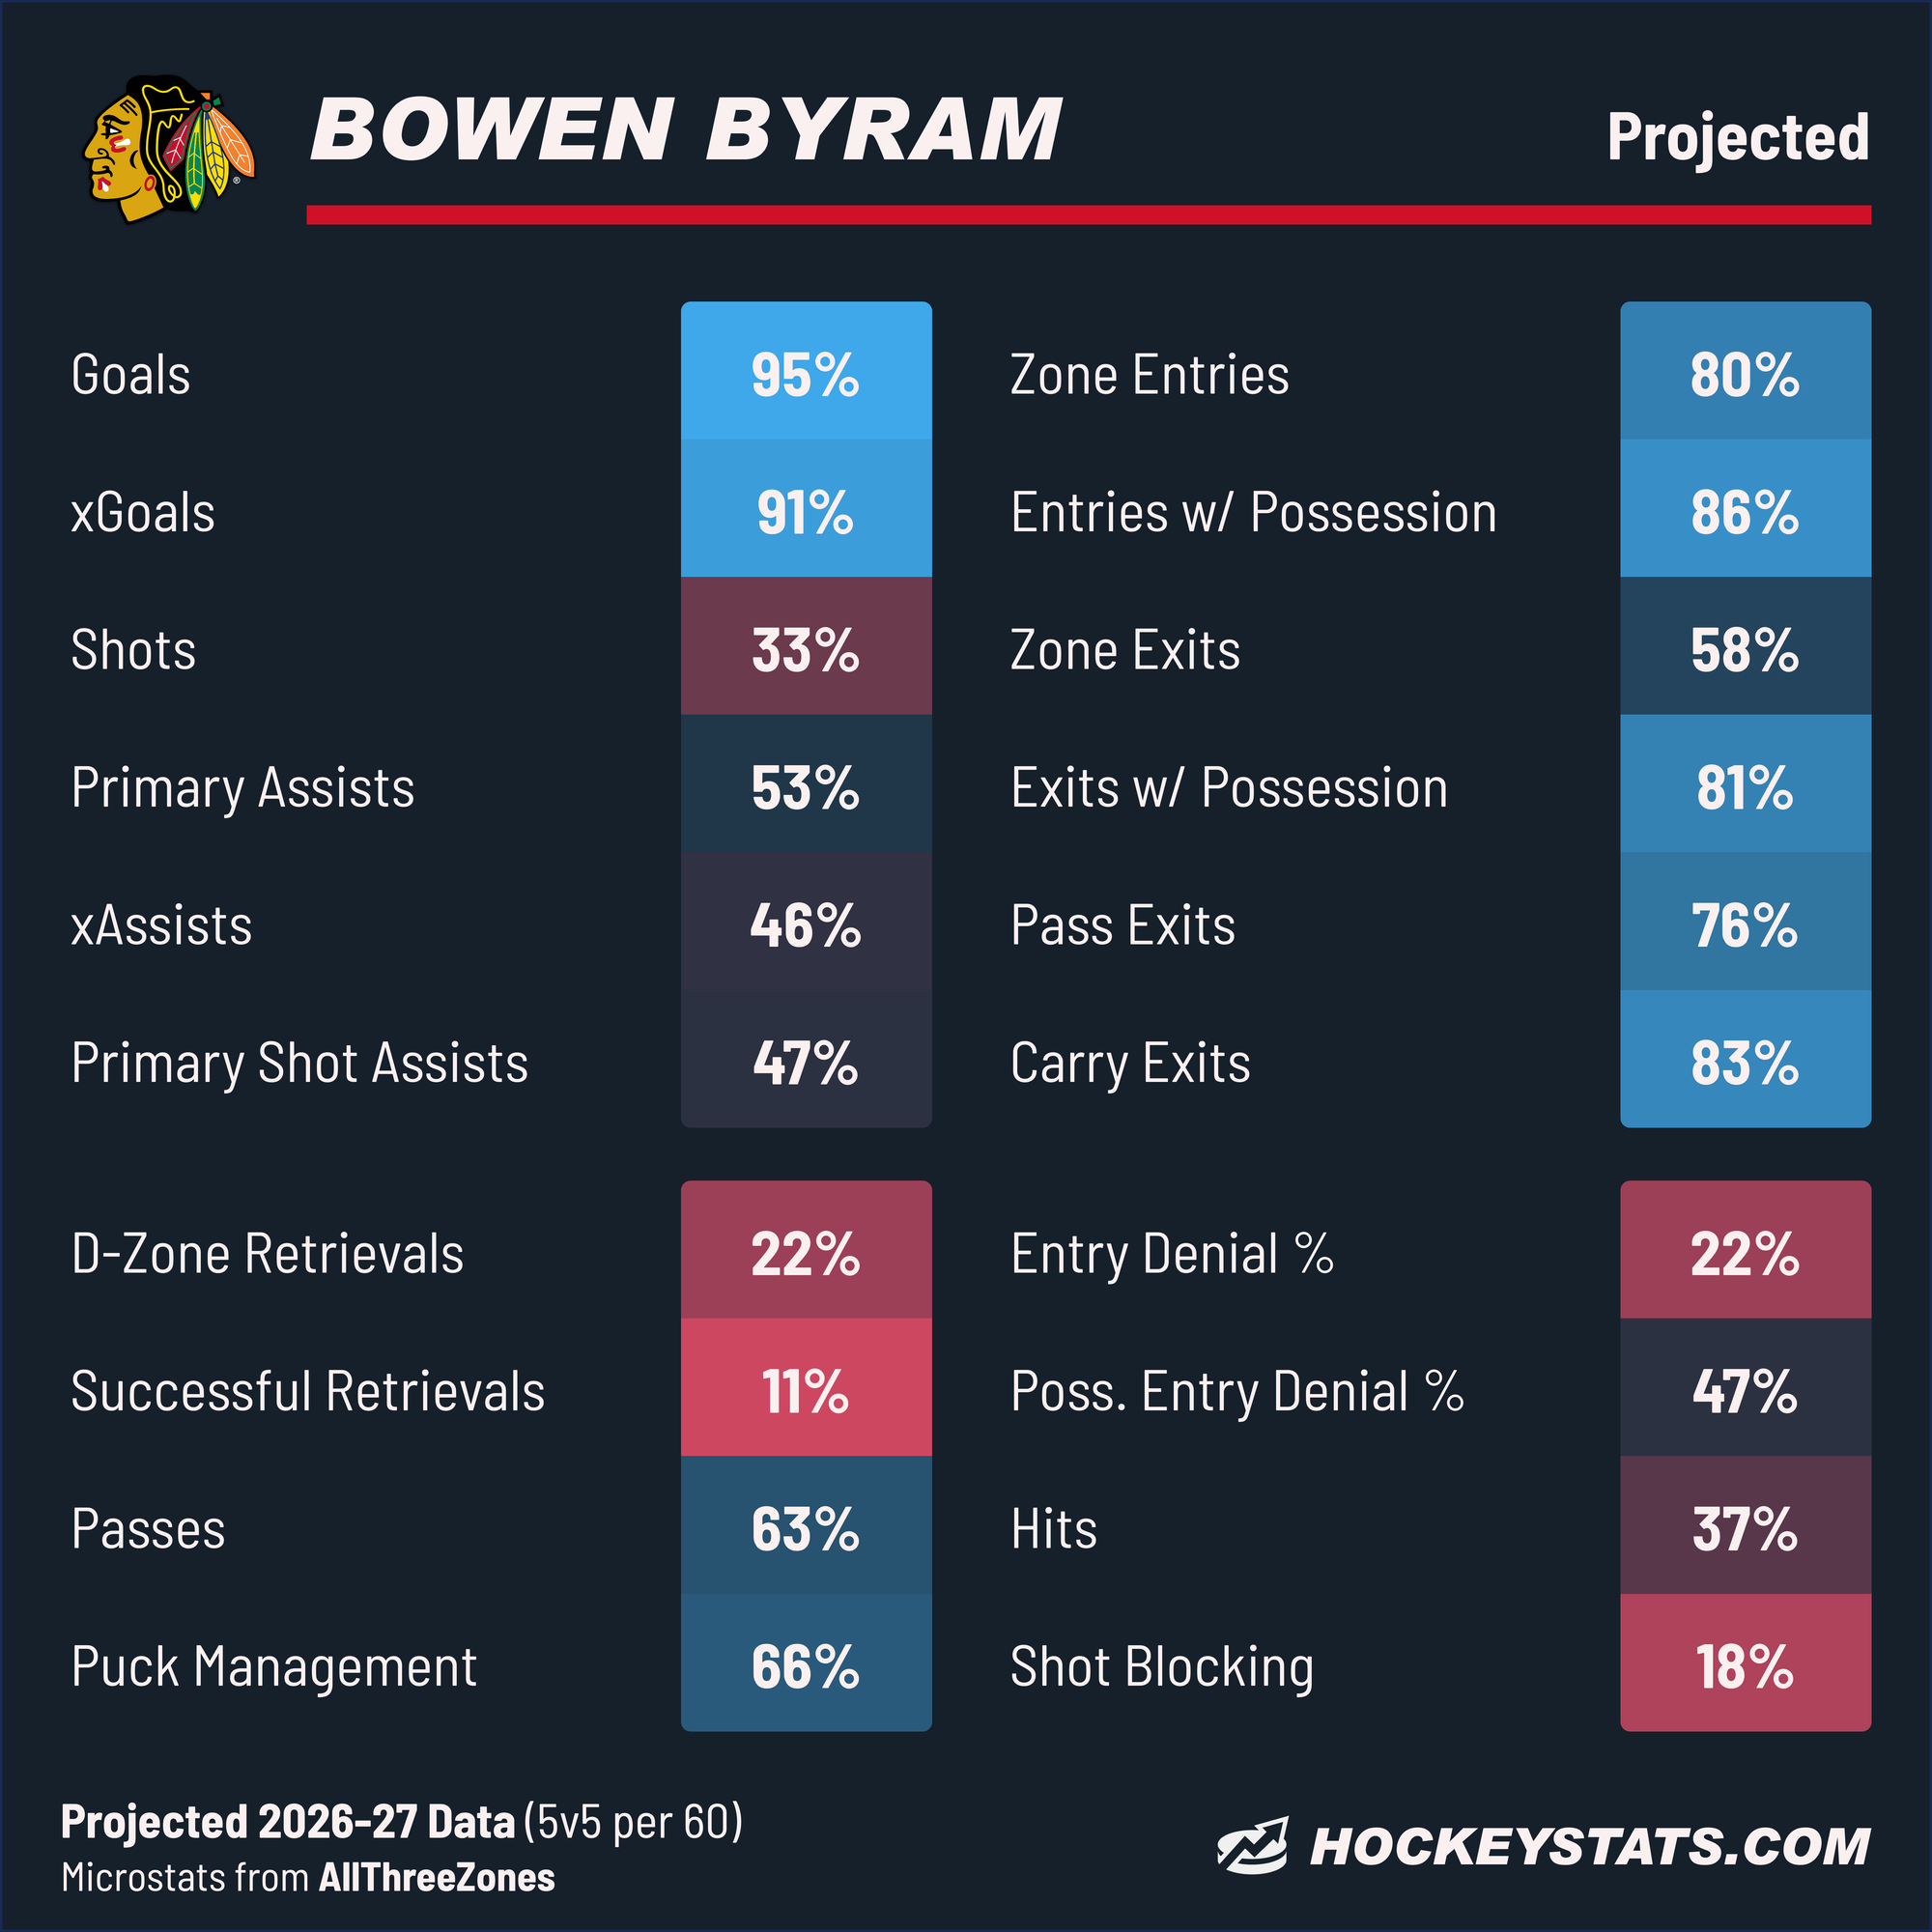
Looking back at the zone entry data, Bowen Byram had the highest controlled carries with four, and only one was a failed entry. Currently, he ranks in the 80th percentile in zone entries according to HockeyStats.com. But Byram finished with five shot attempts and zero shots on goal. Chicago had a 38.80 percent expected goals share with him on the ice at 5-on-5.
Another interesting observation was that the Hawks tended to go for uncontrolled entries in the middle frame with 16, which makes sense considering the long change. That period was also the Islanders' best in terms of possession with a 52 percent unblocked shot attempt share. But when Chicago resorted to more controlled entries towards the middle of the period, the Hawks' scoring chances increased. They finished the second with nine scoring chances versus New York's five.
Tracking zone entries was an incredibly fun way to follow the game. I'll definitely try this again and refine my process. One thing I'm working on adding is tracking unblocked shot attempts following zone entries. But the numbers aren't too surprising. Ideally, we would like to see Chicago carry the puck into the zone more. 39 percent won't cut it, even if it leads to high possession. The issue is the shot quality that ensues. Chicago is struggling to generate high-danger chances. Despite owning the majority of puck possession stats, New York held the edge in high-danger chances 9-8.